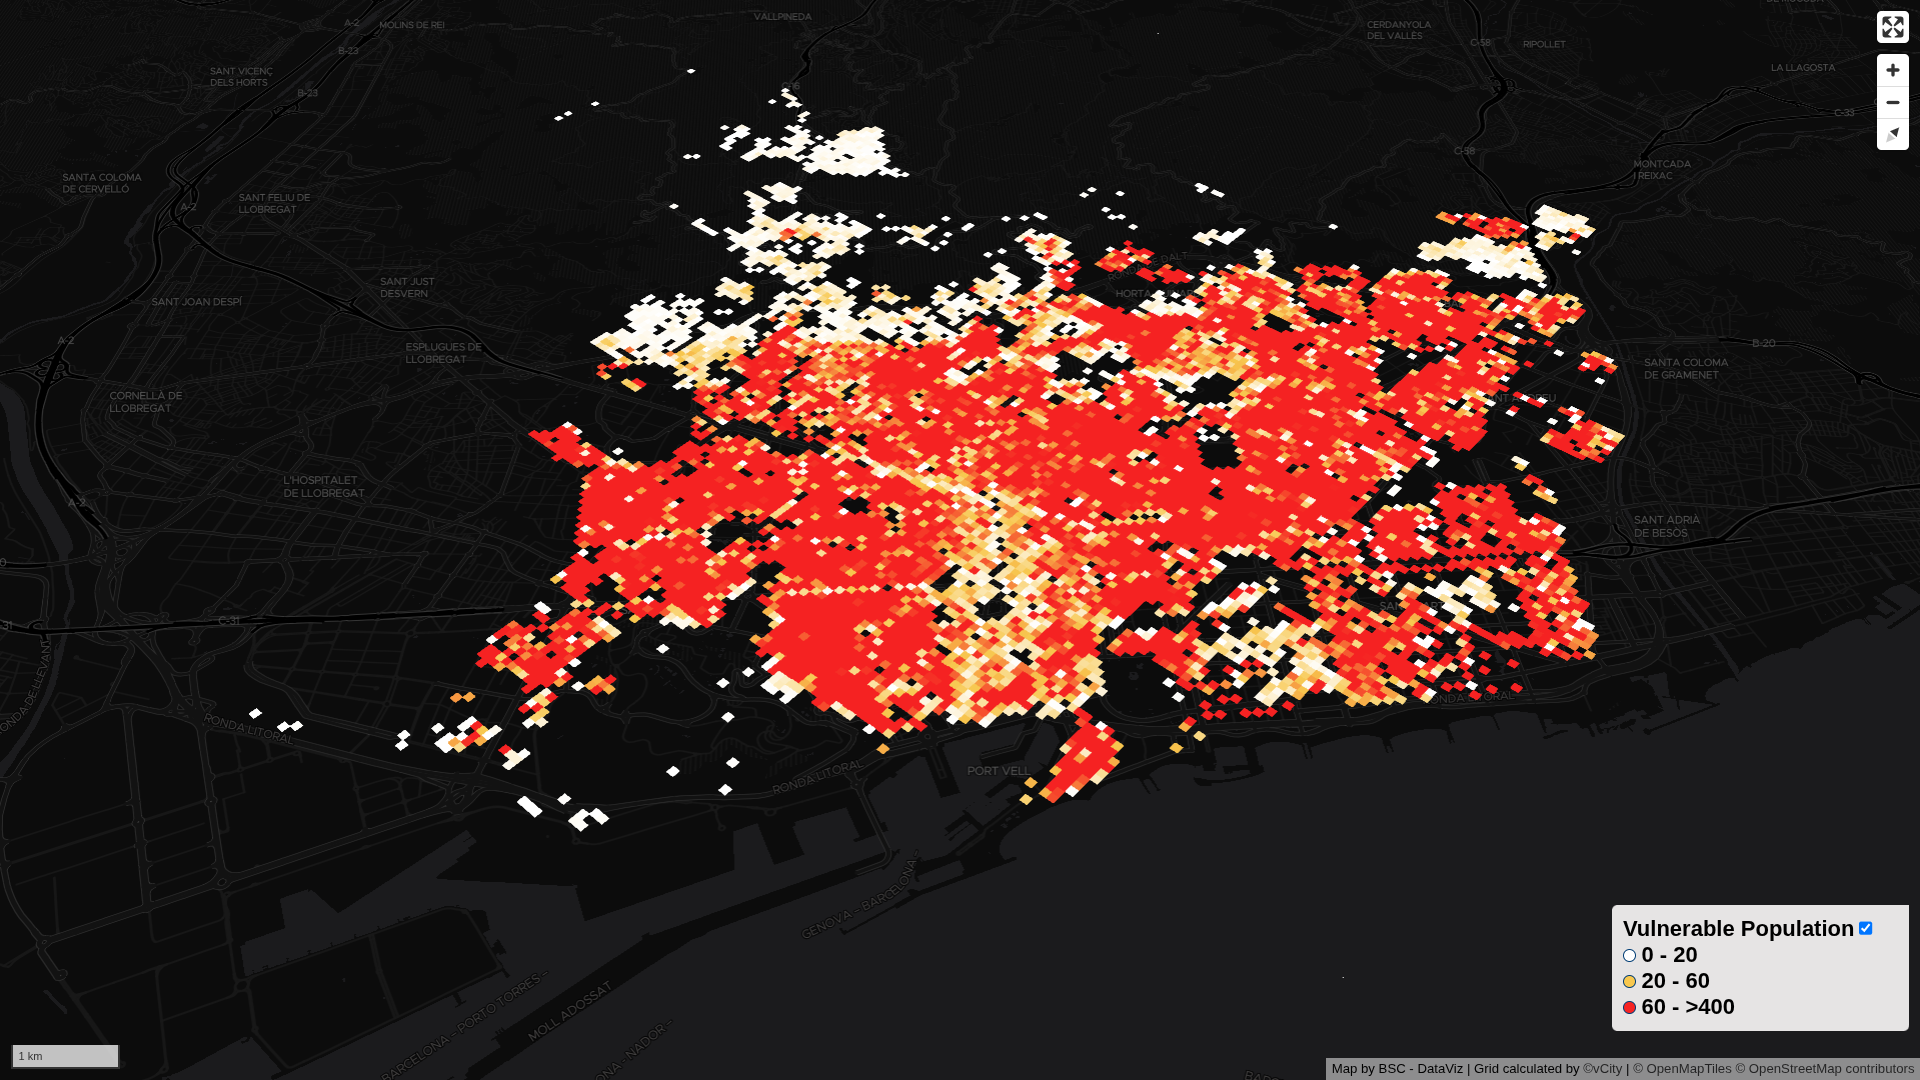
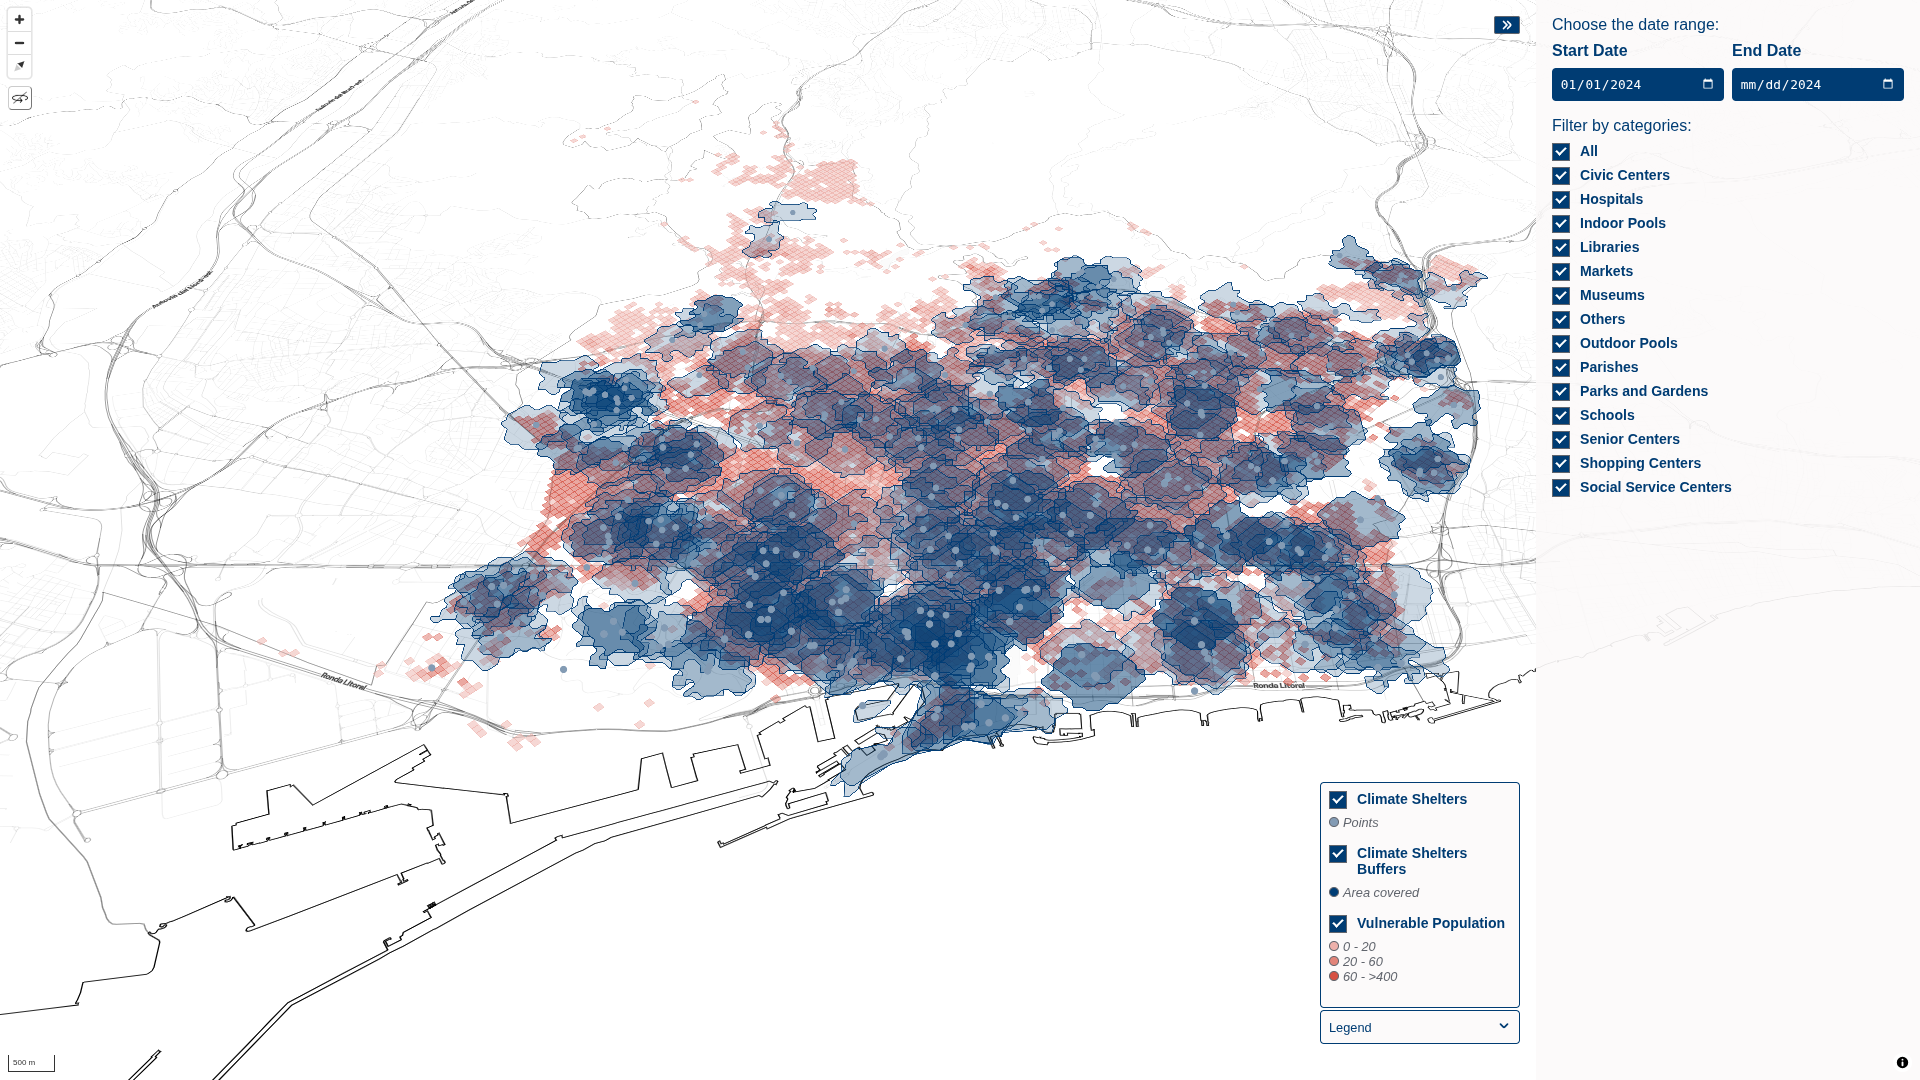
Climate Shelters Maps

Hotfix for the climate shelters app, with fetched geoJSON layers.

Map 0 - Landing map

This map shows a zoom-in + without controls (except stop rotation) of the climate shelters map with the 3 layers.

Layers used:

  • Vulnerable population
  • Climate shelters buffers
  • Climate shelters points

Map 1 - Vulnerability map

EN | ES | CA

This map shows a grid which cointains the amount of vulnerbale population in the city of Barcelona.

Layers used:

  • Vulnerable population

Mapa 2 - Climate Shelters

EN | ES | CA

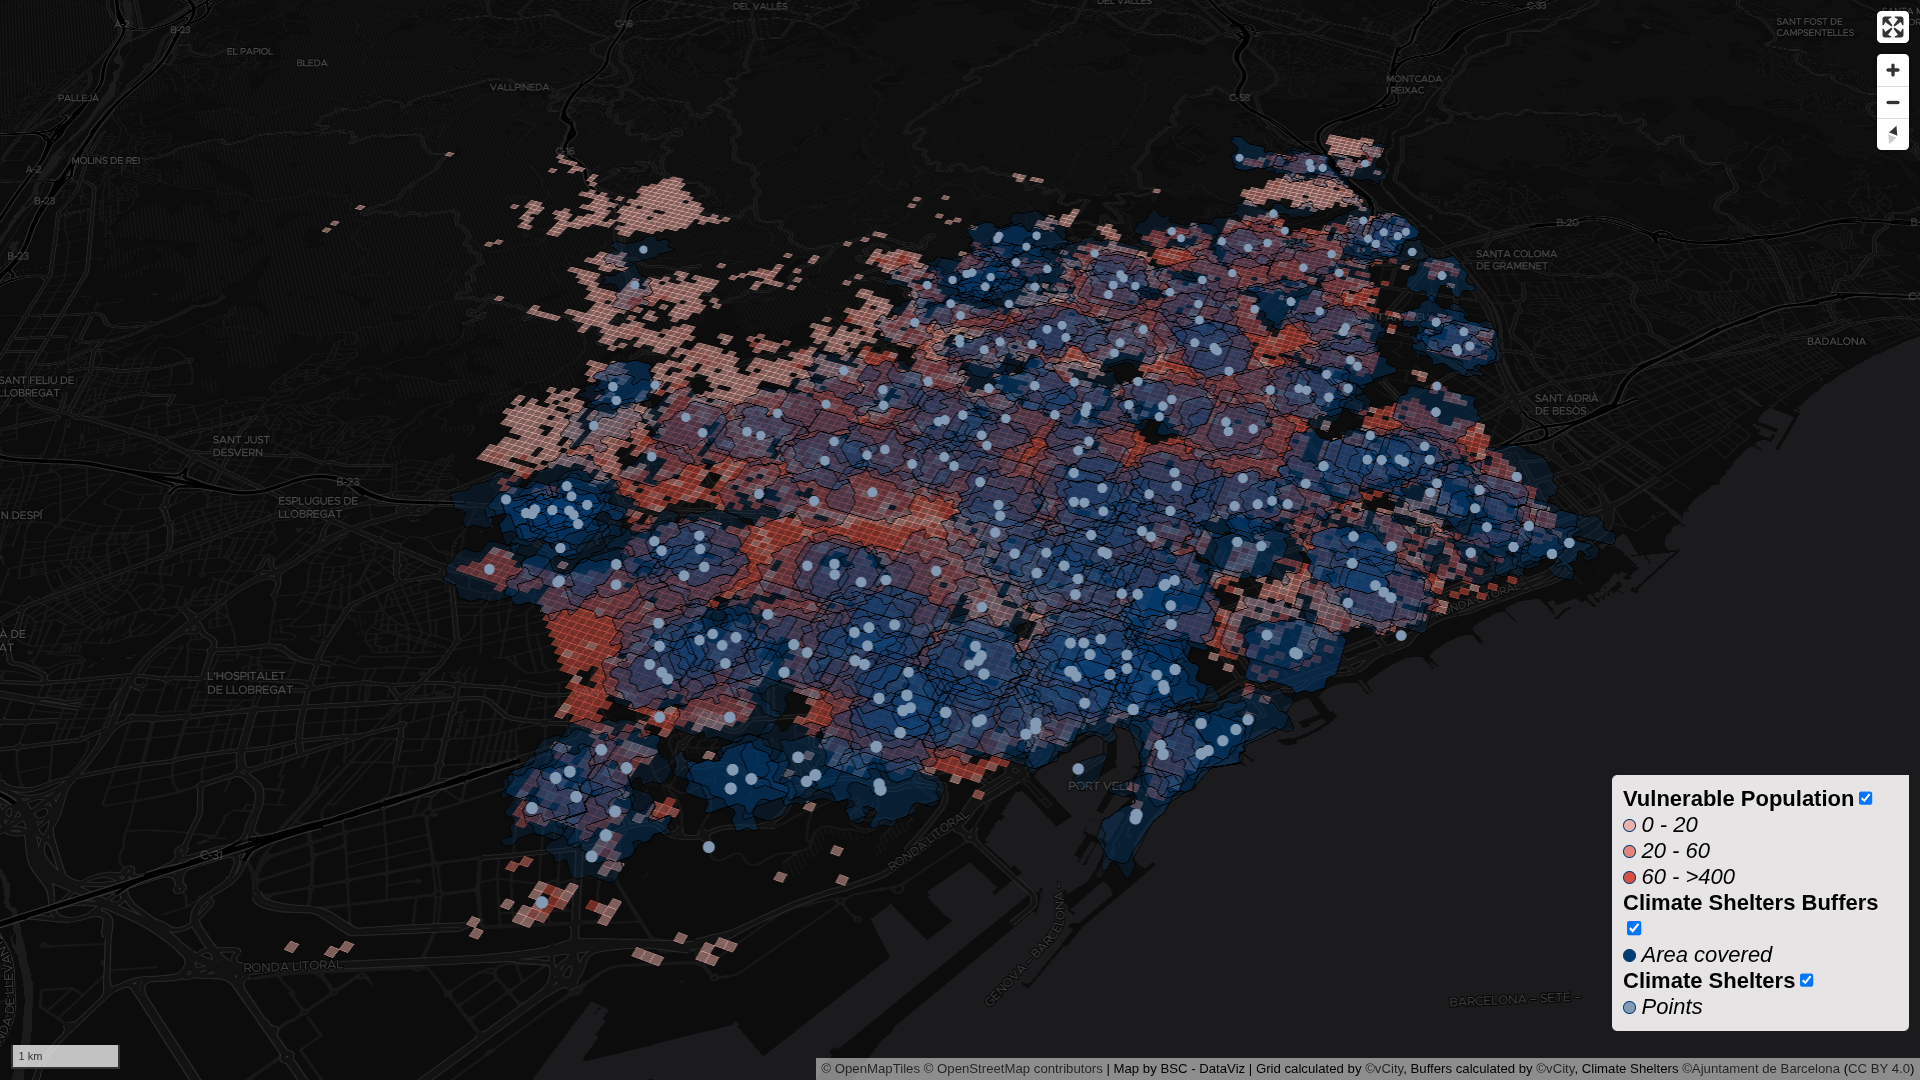
This map cointains all of the layers of the climate shelters app. If you click on the points indicating the positiion of the shelters a pop-up with additional information appears.

Layers used:

  • Vulnerable population
  • Climate shelters buffers
  • Climate shelters points

Mapa 3 - Scheduled climate Shelters

EN | ES | CA

This map shows the coverage of shelters during august, there is a play button and a slider which show how it changes.

Layers used:

  • Vulnerable population
  • Climate shelters buffers

Mapa 4 - Climate shelters with filters

EN | ES | CA

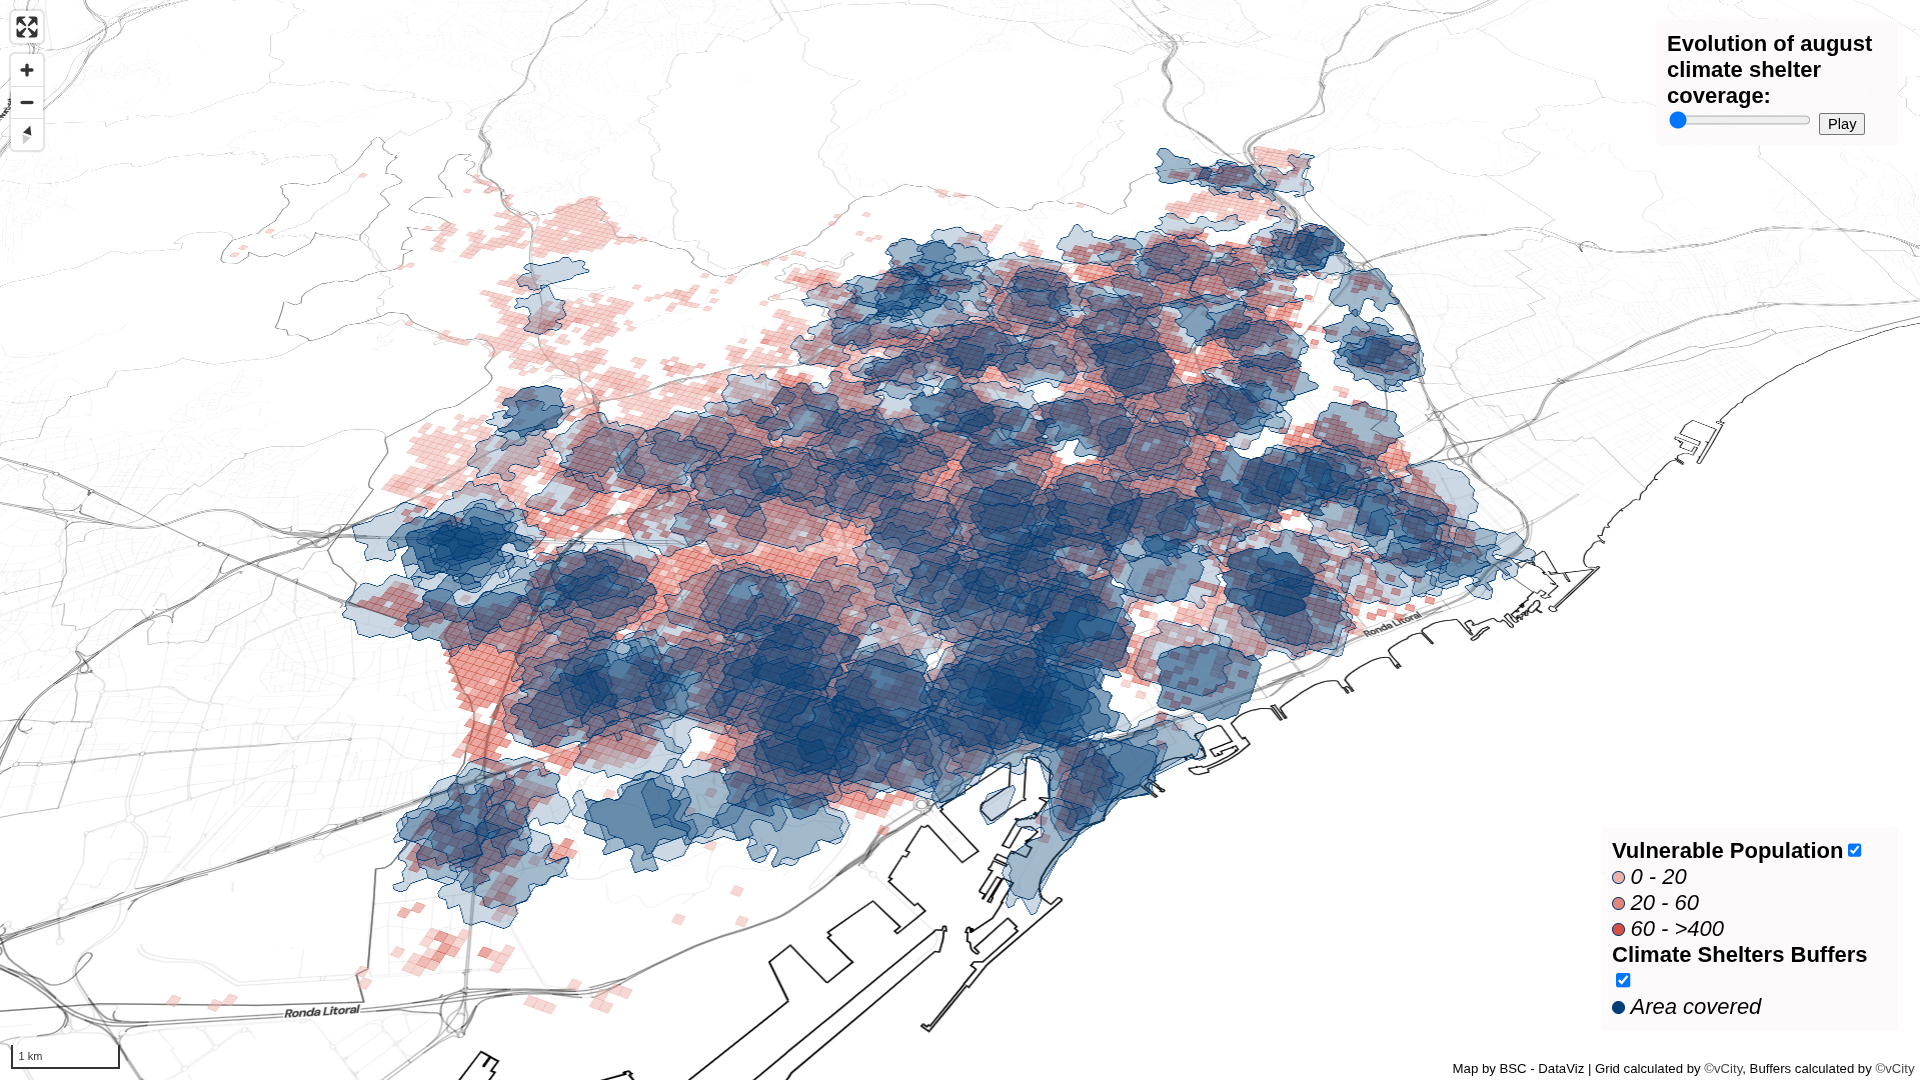
This one is the same as map 2 except it has two additional features:

  • on hovering a buffer it gets highlighted and it opens a pop-up displaying the amount of vulnerable population covered within a radius of 7.5 minutes from a climate shelter
  • the side-panel which cointains two filters: type of shelter and date range

Layers used:

  • Vulnerable population
  • Climate shelters buffers
  • Climate shelters points

Plot 1 - Coverage by district

EN | ES | CA